Tensorboard Visualization Toolkit
TensorBoard is TensorFlow’s visualization toolkit, enabling you to track metrics like loss and accuracy, visualize the model graph, view histograms of weights, biases, or other tensors as they change over time, and much more.
A Step by step guide to use Tensorboard on the HPC/Slurm Cluster.
Initial setup.
- Use the same folder where your code stores data that you want to visualize, copy here the example submit script.
cp /deepstore/software/examples/run-tf-tensorboard.sbatch .
- Modify the tensorboard requirements like required resources, python/anaconda version, conda environment, activate the required module files, etc. in the run-tf-tensorboard.sbatch file.
Further information can be found here :
- https://pytorch.org/tutorials/intermediate/tensorboard_tutorial.html (advanced pytorch opties)
Starting the tensorboard server
- Submit the job by running the following command :
sbatch run-tf-tensorboard.sbatch
The command will show a <job id>, wait until the job is actually running. Use this <job id> to check the content of the tensorboard-<job id>.log file. This will file will contain the required url to connect to tensorboard using your local webbrowser.
Connect to tensorboard.
Now you can connect to your tensorboard by opening the URL listed in the log file on your local web browser.
http://<nodename>.ewi.utwente.nl:<port>/
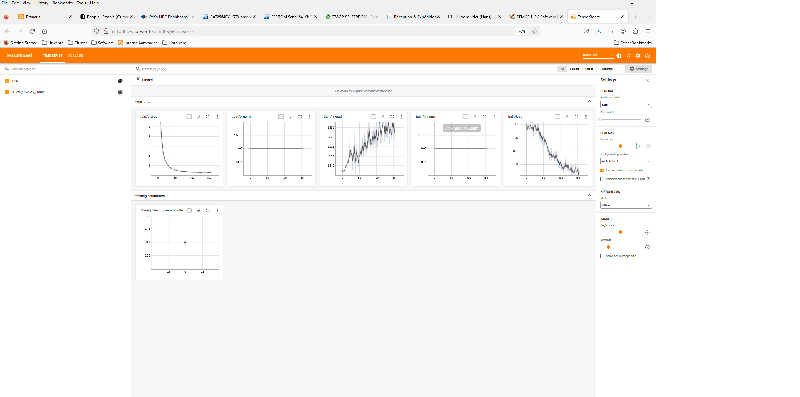
If everything is being setup correctly, tensorboard will show up in your browser :
